Services · InovaMine
Turn clinical trial and real-world data into dynamic tables, figures and listings. Build subcohorts, answer questions in real time and trace results back to source. InovaMine executes your statistical analysis plan (SAP), with automated testing throughout and statistician review before outputs are released.
Illustrative output view
How it works
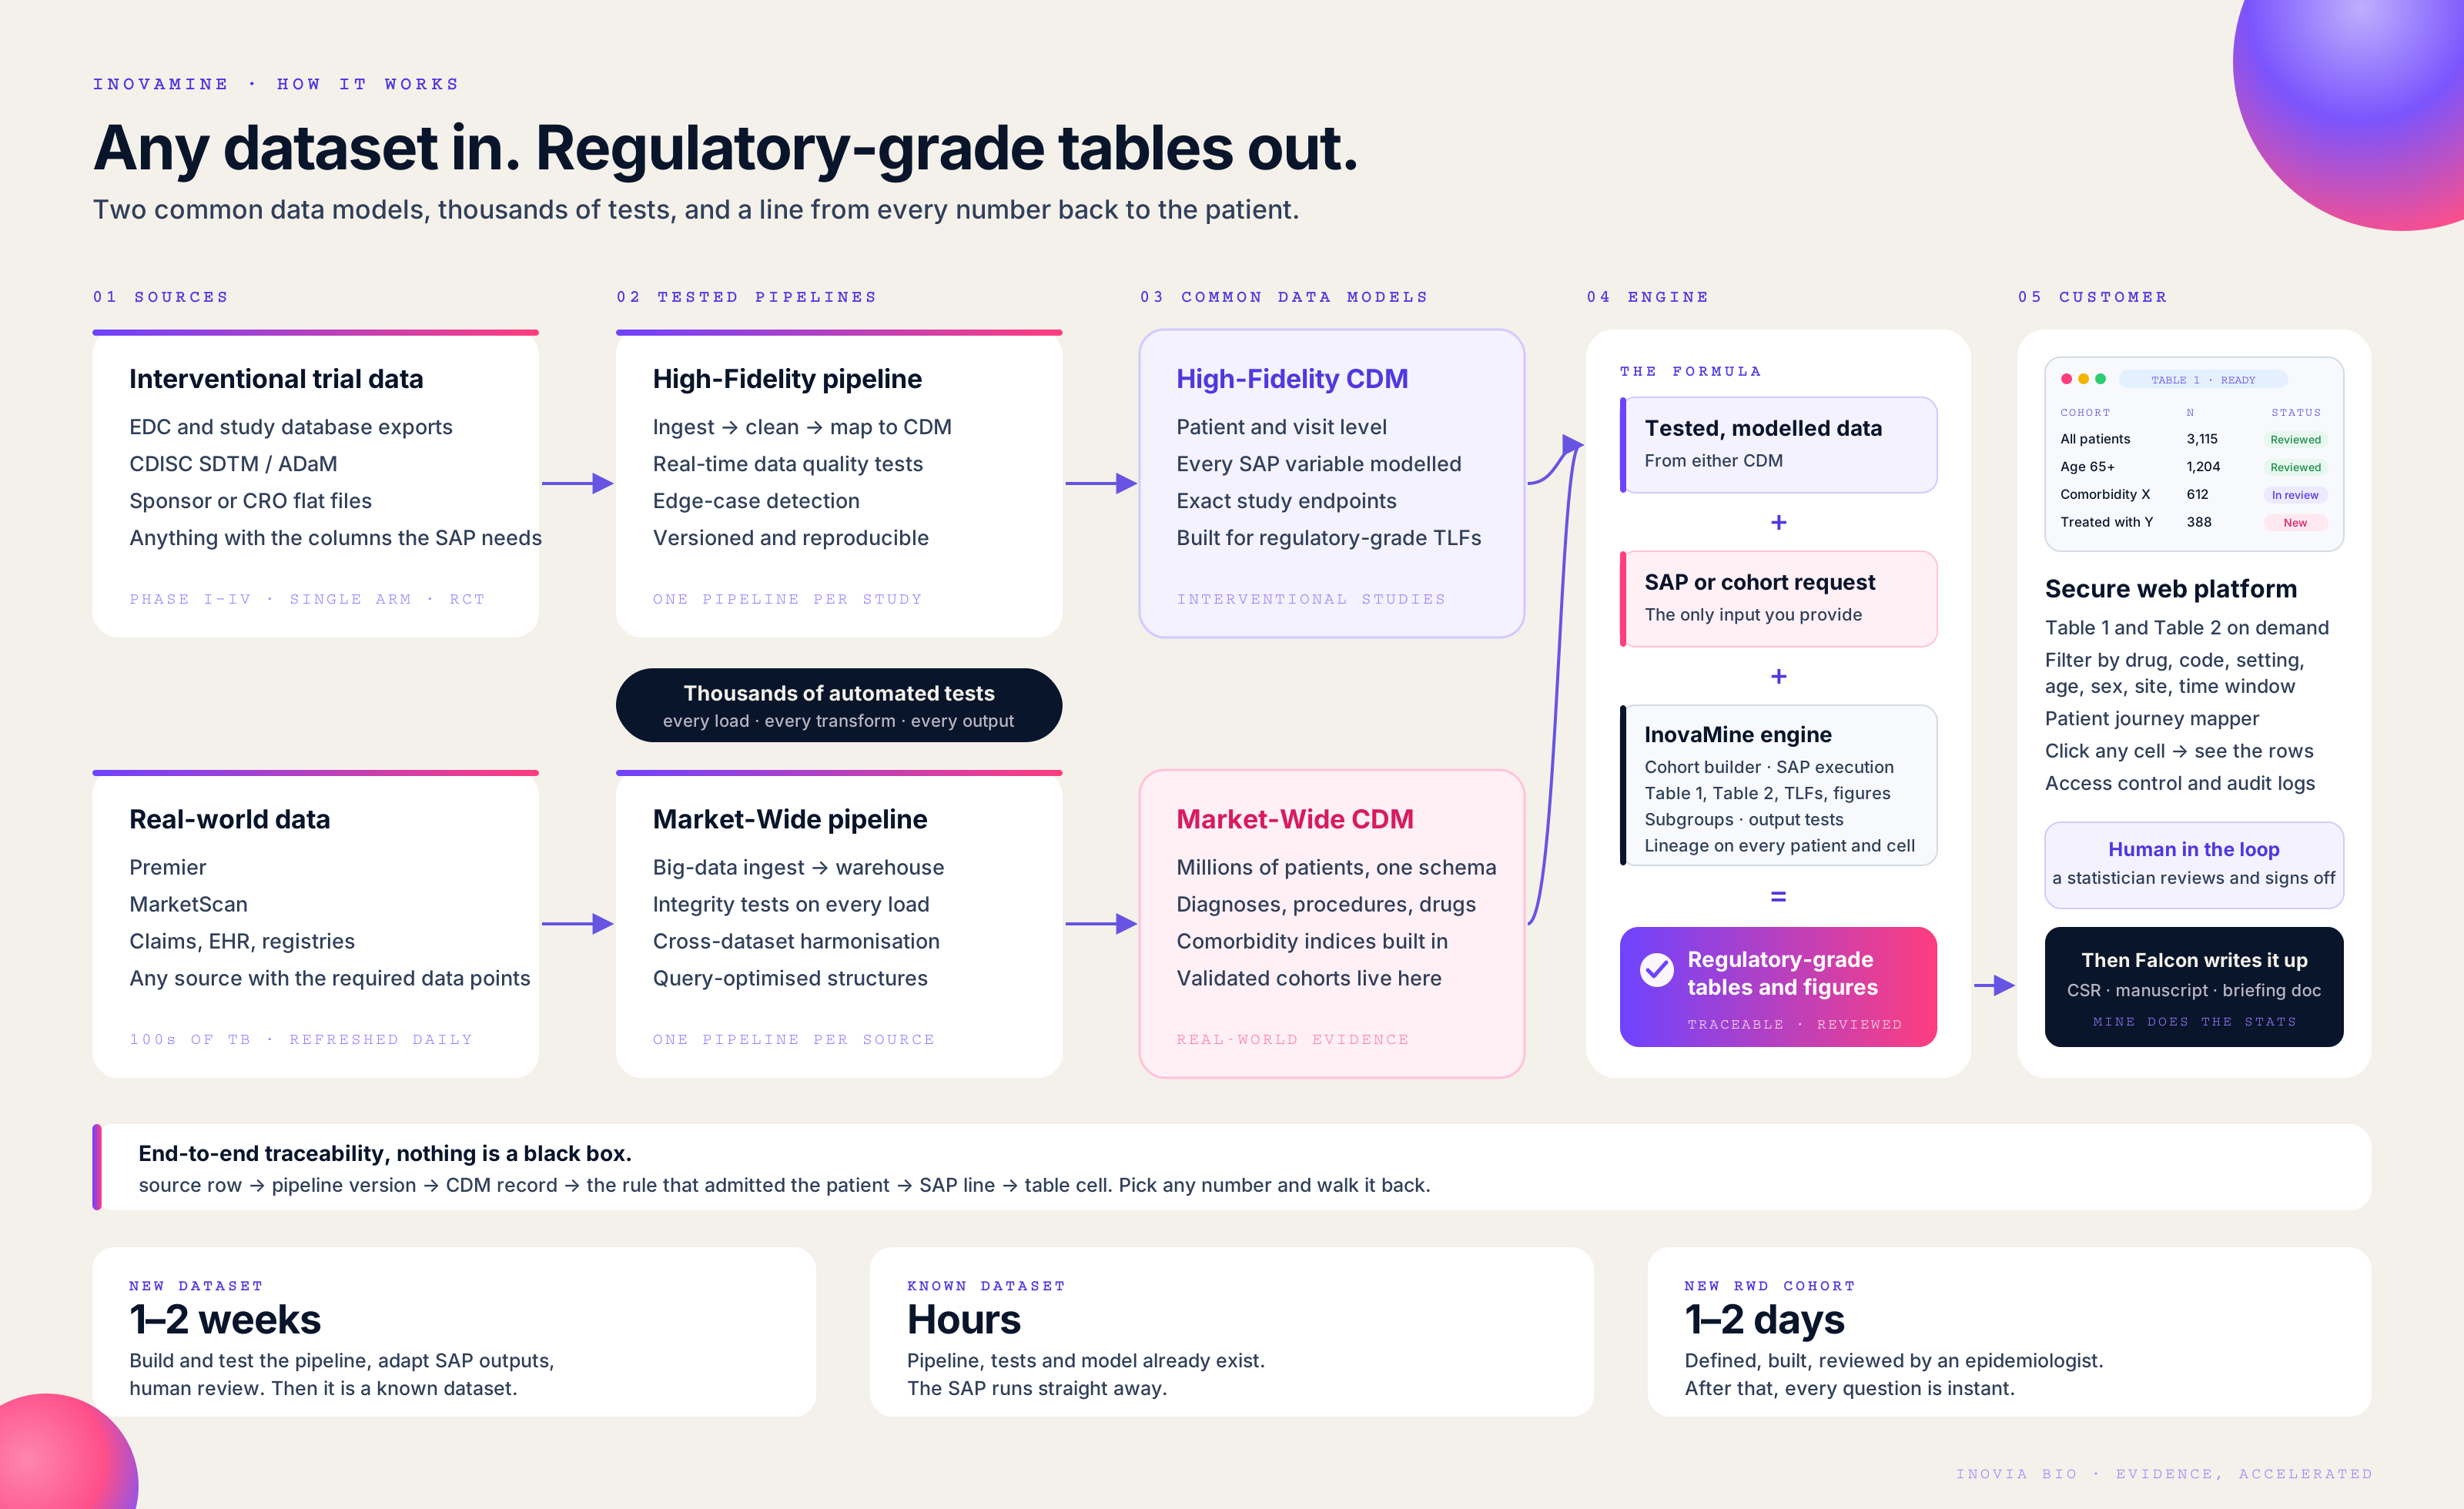
Two common data models, thousands of automated tests, and a line from every number back to the patient.
From analysis to answers
Work with dynamic tables, figures and listings in a secure web platform. Once your data is mapped and tested, build subcohorts and answer follow-up questions in real time.
Biostatisticians and epidemiologists focus on the design, estimand choices and interpretation. A statistician reviews and signs off before outputs are released.
Explore baseline characteristics, endpoints, effect estimates and subgroups through dynamic outputs connected to your analysis.
Build subcohorts by treatment, clinical code, setting, age, sex, site or time window. Refine your questions and explore answers in real time. Use patient journeys to understand inclusion.
Open a table cell to inspect the underlying rows, with access controls and audit logs supporting review.
Reviewed results can feed Falcon workflows for a clinical study report, manuscript or briefing document.
Tell us about your data source and the question you need to answer. We’ll scope the analysis, onboarding and review.
